
Table of Contents

How to Turn Brij Analytics Into Revenue-Driving Insights

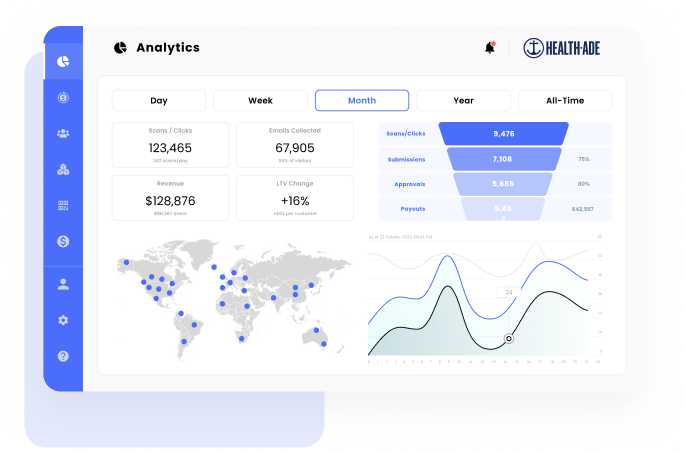
- The Brij Analytics Dashboard links first-party data capture from QR scans, registrations, and rebates to downstream website behavior and ecommerce revenue outcomes.
- Core funnel metrics include scans/clicks, registrations/sign-ups, engagements, profiles created, and website visits, enabling scan-to-registration and stage-by-stage drop-off analysis.
- Revenue reporting separates total revenue from Brij-acquired profiles, direct revenue generated within Brij experiences, projected total value captured, and annualized run-rate metrics.
- Receipt insights provide retailer-, store-, and SKU-level purchase visibility by validating line items and connecting offline purchases to individual customer profiles.
- Segmentation views and geographic heatmaps surface performance differences by experience, retailer, region, language, and device to guide optimization and resource allocation.
By capturing first-party data at the moment customers interact with your products—whether through QR code scans, product registrations, or digital rebates—Brij transforms disconnected transactions into actionable customer relationships. But collecting data is only half the story. The real power lies in understanding what that data reveals about your business.
That's where the Brij Analytics Dashboard comes in. It's not just a reporting tool—it's your command center for measuring engagement, proving ROI, optimizing experiences, and making data-driven decisions that directly impact revenue.
Whether you're justifying budget to leadership, optimizing a rebate campaign, or strengthening retailer relationships, the analytics available through Brij give you the visibility and intelligence that were previously impossible for offline and marketplace sales.
Let's explore the metrics that matter most, why they're critical to your business, and exactly how to use them to drive measurable results.
Scans & Clicks: Measuring Experience Awareness and Demand
What It Measures
Total number of QR code scans or link clicks in a selected period. Unique scans exclude repeated scans from the same user in quick succession, ensuring you're measuring genuine traffic rather than duplicate interactions.
Why It Matters
Scans represent the very top of your customer engagement funnel. This metric reveals how effectively your packaging callouts, retail point-of-sale materials, influencer partnerships, and marketing campaigns are driving awareness and interest. High scan volume indicates strong customer curiosity—whether prompted by compelling packaging design, strategic retail placements, or successful digital campaigns.
For brands selling through wholesale channels, scans are especially valuable because they represent moments where customers who purchased through a third-party retailer are actively choosing to connect with your brand directly. This is your first touchpoint with someone who might otherwise remain anonymous forever.
How to Use It
- Optimize packaging and POS materials: If scans surge in certain retail channels or geographic locations, double down on those placements. Work with retail partners to replicate successful displays, shelf positioning, or promotional materials in underperforming locations.
- A/B test callouts and incentives: Experiment with different QR code placements, messaging ("Scan to Register Your Product," "Unlock Your Rebate," "Get Setup Instructions"), and value propositions. Track scan volume by experience variant to identify which approaches resonate most with your audience.
- Influencer and marketplace attribution: Compare scan volume by traffic source to see which partnerships, creators, or marketplaces actually drive engagement. This data helps you allocate influencer budgets more effectively and identify high-performing collaboration opportunities.
- Identify seasonal patterns: Track scan trends over time to understand when customers are most engaged with your products. Use these insights to time campaigns, promotions, and product launches for maximum impact.
Registrations & Sign-Ups: Measuring Intent and First-Party Data Capture
What It Measures
Total number of users submitting their email address or phone number through Brij experiences during a given period
Why It Matters
Registrations represent high-intent signals. Unlike passive engagement, someone who provides their contact information is actively expressing interest in staying connected with your brand. This metric reveals the effectiveness of your incentive strategy, the clarity of your value proposition, and your ability to convert curious scanners into owned customer contacts.
Since Brij transforms retail and marketplace buyers into owned audience members, registrations directly measure your success at building a first-party database from channels where customer data was previously unavailable. This is the foundation of your ability to drive incremental revenue through email, SMS, and personalized marketing.
How to Use It
- Assess incentive strength: If scans are high but registrations are low, your conversion funnel has friction. Test stronger offers—whether that's cash rebates, product warranties, exclusive content, or giveaway entries. Monitor which incentives drive the highest submission rates across different product categories or customer segments.
- Understand customer motivation: Analyze which experiences drive the highest registration rates. Product registration experiences may perform differently than rebate offers or educational content. Use these insights to tailor your approach by product line, price point, or customer segment.
- Calculate conversion rate: Divide registrations by scans to understand your scan-to-registration conversion rate. Industry benchmarks vary, but this metric helps you assess whether your experience design, incentive, or messaging needs optimization. Track this rate over time and across experience variants to continuously improve performance.
- Feed your CRM and marketing automation: Ensure registration data flows seamlessly to Klaviyo, Attentive, HubSpot, or your preferred marketing platform. Tag new profiles with attributes like product purchased, registration date, and experience type to enable sophisticated segmentation and personalized flows.
Engagements: Understanding In-Experience Behavior
What It Measures
Every time a user views a Brij landing page or interacts with a specific module—whether that's product details, recipes, educational content, rebate instructions, or warranty information.
Why It Matters
Engagements reveal what content your customers find genuinely useful and where they spend time during their experience. This metric goes beyond surface-level scans to show you which elements of your experience are capturing attention and driving deeper interaction. High engagement indicates that your content is relevant, valuable, and meeting customer needs.
Understanding engagement patterns helps you identify friction points, optimize content strategy, and design experiences that guide users toward your desired outcomes—whether that's completing registration, visiting your website, or learning how to use your product effectively.
How to Use It
- Optimize page content and structure: If you're seeing high traffic but low next-step conversions, your messaging may be unclear or your call-to-action weak. Rework copy, simplify instructions, or reduce form fields to minimize friction. Compare engagement across different module types to understand which content formats resonate most.
- Test and iterate on modules: See which modules—product education, warranty information, recipe content, sustainability messaging—drive the deepest engagement. Use this data to prioritize content development and eliminate modules that aren't delivering value.
- Identify drop-off points: If users engage with your landing page but don't proceed to registration or other key actions, analyze the experience flow. Are you asking for too much information too soon? Is the value proposition clear? Use engagement patterns to diagnose and address conversion barriers.
- Localize experiences strategically: Compare engagement by country, language, or region to understand which content translates effectively across markets and where localization efforts should be focused. If certain regions show high scans but low engagement, your content may not be resonating culturally or linguistically.
Profiles Created: Building Your Owned Audience
What It Measures
The total number of new customer profiles—email addresses or phone numbers—collected through Brij during a specified reporting period.
Why It Matters
Since Brij's core value proposition is transforming retail and marketplace buyers into owned contacts, this metric directly measures your success at building a first-party customer database. Unlike scans or engagements, profiles represent customers you can now reach directly through email and SMS marketing, regardless of where they purchased your product.
For brands selling primarily through wholesale channels, profiles created is arguably the most critical metric in your dashboard. Each new profile represents a previously anonymous customer who is now part of your owned audience—someone you can nurture, educate, and market to over time. This is the foundation of building direct relationships and driving incremental revenue from retail and marketplace sales.
How to Use It
- Measure customer acquisition cost efficiency: Calculate your cost per profile by dividing your Brij investment by profiles created. Compare this cost to paid social acquisition, affiliate channels, or other customer acquisition tactics. For many brands, capturing profiles through product-based experiences delivers substantially lower acquisition costs than traditional digital advertising.
- Track omnichannel coverage: Calculate what percentage of your total retail and marketplace buyers you're successfully capturing as profiles. If you sell 10,000 units monthly through Target and capture 2,000 profiles, you have a 20% capture rate. Use this metric to set benchmarks and identify opportunities to improve capture rates through better packaging callouts, stronger incentives, or strategic retail partnerships.
- Segment by experience type: Compare profile capture rates across different experience types—rebates, warranties, product registration, educational content. Understanding which approaches drive the highest profile acquisition helps you allocate resources and design future campaigns strategically.
- Forecast database growth: Track profiles created month-over-month to project future database size. This helps with marketing planning, ESP capacity management, and demonstrating the long-term value of your Brij investment to leadership.
Website Visits: Tracking Downstream Digital Behavior
What It Measures
Every time a user is directed from a Brij experience to your ecommerce website, product pages, or other external destinations.
Why It Matters
This metric creates an attribution loop that's extremely rare in retail and marketplace selling: it directly connects offline product interactions (scanning a QR code on packaging in a physical store) to digital behavior on your website.
For brands, this is transformative. You can now measure how in-store purchases drive ecommerce traffic, how product education experiences lead to cross-sell opportunities, and how first-time buyers from wholesale channels convert into direct customers.
Website visits from Brij experiences represent warm, product-aware traffic. These aren't cold prospects clicking on a social ad—they're customers who already purchased your product or are actively considering it. This makes them significantly more valuable and more likely to convert on subsequent purchases.
How to Use It
- Measure how packaging drives ecommerce: Track website visits by product SKU to understand which products are most effective at driving customers from retail purchases to your direct channel. Use this intelligence to optimize packaging design, callouts, and QR code placement on future product launches.
- Enable post-purchase cross-sell: Route customers from product-specific experiences to curated landing pages featuring complementary products, accessories, or bundles. Track conversion rates to optimize product recommendations and merchandising strategy.
- Shorten the path to repeat purchase: For consumable products, use Brij experiences to drive customers directly to subscription or reorder pages. Measure website visits and subsequent conversion rates to understand how effectively you're converting retail customers into DTC subscribers.
- Attribute retail-to-DTC conversion: Calculate how many customers who first purchased through a retail partner later bought directly from your website. This metric helps justify continued retail investment while demonstrating the long-term value of omnichannel customer acquisition.
Revenue Metrics: Quantifying Direct Business Impact
Brij's revenue tracking capabilities help brands measure the incremental ecommerce revenue directly tied to customer profiles captured through on-product experiences. These metrics transform Brij from a data collection tool into a proven revenue driver.
Total Revenue
What It Measures
All ecommerce orders placed by customers who registered or signed up via Brij experiences—not just their first purchase, but every subsequent transaction over time.
Why It Matters
Total revenue demonstrates the long-term value of owning customer data. A customer who scans a QR code after buying your product at Target might place their next order on your website. Then another. Then they subscribe. Total revenue captures all of that incremental business, showing how Brij-acquired customers contribute to your bottom line over months and years, not just at the moment of registration.
- Demonstrate ongoing ROI: Show leadership how Brij continues to drive revenue long after the initial interaction. Unlike one-time acquisition costs, the customers you capture through Brij deliver compounding returns as they make repeat purchases.
- Justify marketing investment: Calculate the total revenue generated by Brij-acquired profiles compared to your investment. For most brands, the ROI becomes overwhelmingly positive within months as customers make subsequent purchases.
- Segment high-value cohorts: Identify which products, retailers, or campaigns acquire customers who generate the most total revenue. Double down on these high-performing channels and replicate successful strategies.
Direct Revenue
What It Measures
Ecommerce revenue from customers who completed checkout directly through a Brij experience—meaning they purchased without leaving the experience flow.
Why It Matters
Direct revenue shows which experiences convert immediately, not just collecting customer data but driving instant transactions. This is particularly valuable for limited-time offers, flash sales, or reorder prompts embedded directly in product experiences.
How to Use It
- Identify high-converting experiences: Compare direct revenue across different experience types and designs to understand which formats drive immediate purchases. Use these insights to optimize checkout pathways and reduce friction.
- Test embedded commerce strategies: Experiment with product recommendations, cross-sells, and reorder prompts within your Brij experiences. Track direct revenue to measure the effectiveness of in-experience commerce versus routing customers to your website.
- Optimize for instant conversion: If certain products or offers consistently drive direct revenue, consider streamlining those experiences even further—reducing form fields, pre-filling information, or offering one-click purchasing to maximize immediate conversions.
Total Value Captured
What It Measures
The projected long-term value of all customer profiles captured through Brij. This is calculated by multiplying the expected lift in Customer Lifetime Value (CLV) per owned customer by the number of profiles collected during the reporting period.
Why It Matters
Total Value Captured is the strategic metric that quantifies why owning customer data matters. When you capture a profile through Brij, you're not just getting an email address—you're gaining the ability to market to that customer over their entire lifetime.
Industry research consistently shows that customers you can reach directly through owned channels (email, SMS) spend significantly more over time than those you can't.
This metric puts a dollar value on your first-party data asset, helping you communicate ROI to leadership, justify budget allocation, and demonstrate the strategic importance of customer data ownership.
How to Use It
- Communicate ROI to leadership and stakeholders: When explaining the value of Brij, don't just talk about profiles collected—talk about total value captured. This metric translates data collection into business impact that executives and finance teams understand.
- Forecast customer LTV expansion: Track how total value captured grows over time as you collect more profiles and refine your marketing to increase CLV. Use this to project future revenue potential and set strategic goals.
- Benchmark against acquisition costs: Compare total value captured to your total investment in Brij and related marketing efforts. For most brands, the projected long-term value of owned profiles significantly outweighs acquisition costs within the first year.
- Strengthen retailer relationships: Share total value captured data with retail partners to demonstrate that your product's value extends beyond the initial transaction. Retailers who understand that your products drive long-term customer relationships are more likely to provide premium shelf space and promotional support.
Annual Revenue Run Rate
What It Measures
The annualized projection of ecommerce revenue generated from customers acquired through Brij experiences. This metric takes recent revenue performance and scales it to show what you could expect over a full year.
Why It Matters
Annual revenue run rate helps you forecast and plan. By taking your current performance and projecting it forward, you can set realistic targets, allocate marketing budgets, and communicate growth trajectories to leadership and investors. This metric is particularly useful for brands in growth mode who need to demonstrate the scalability of their customer acquisition strategy.
How to Use It
- Forecast future DTC revenue: Use annual revenue run rate to project how much incremental direct revenue you can expect from your Brij-acquired customer base. This helps with inventory planning, cash flow management, and growth projections.
- Benchmark growth over time: Track how your annual revenue run rate increases month-over-month or quarter-over-quarter. Accelerating growth rates demonstrate that your customer acquisition and retention strategies are working effectively.
- Set strategic targets: Use current run rate as a baseline to set ambitious but achievable revenue goals. If your run rate is $500K annually from Brij-acquired customers, what would it take to reach $1M? How many more profiles do you need? What conversion rate improvements would get you there?
Revenue Per Profile and Annual Revenue Per Profile
What It Measures
Revenue Per Profile calculates the amount of revenue generated per active profile during a defined time period. Active profiles represent the total number of profiles in your account on each day of the reporting period—not just new profiles collected. Annual Revenue Per Profile annualizes this value by scaling the period result to a yearly projection.
Why It Matters
These metrics reveal the true revenue value of owning a customer and how effectively your CRM, email flows, and SMS campaigns are monetizing your audience. If your Revenue Per Profile is increasing over time, it means your marketing is getting more effective at driving repeat purchases. If it's decreasing or stagnant, it signals an opportunity to improve lifecycle marketing, segmentation, or personalization.
For brands selling through retail and marketplace channels, Revenue Per Profile is proof of incremental value. Every customer you capture through Brij isn't just a name in a database—they're a revenue-generating asset.
How to Use It
- Prioritize lifecycle marketing improvements: If your Revenue Per Profile is lower than expected, it indicates your email and SMS flows need work. Focus on optimizing welcome series, post-purchase flows, win-back campaigns, and personalized product recommendations.
- Make data-driven investment cases: When justifying marketing technology investments, product launches, or campaigns, use Revenue Per Profile to quantify impact. If a new email flow increases Revenue Per Profile by 10%, you can calculate exactly how much additional revenue that represents across your entire database.
- Segment by cohort or source: Compare Revenue Per Profile for customers acquired through different experiences, products, or retailers. If customers who register products generate higher Revenue Per Profile than those who claim rebates, adjust your strategy to prioritize product registration experiences.
- Set benchmarks and goals: Track how your Annual Revenue Per Profile improves over time. If the industry benchmark for your category is $50 annually per owned profile, and you're at $30, you have a clear opportunity to close that gap through better marketing.
Geographic Map: Location-Based Behavior Insights
What It Shows
A visual heatmap showing where customers are scanning QR codes or registering products based on their location when the interaction occurred.
Why It Matters
Geographic data unlocks powerful insights about regional demand, retail placement effectiveness, and marketing opportunities. For brands with physical retail distribution, this map reveals which locations are driving the most customer engagement—and by extension, where your products are resonating most strongly.
Understanding geographic patterns helps you make smarter decisions about retail expansion, regional marketing campaigns, and resource allocation. If you're seeing high engagement in the Pacific Northwest but low engagement in the Southeast despite similar distribution, that insight demands investigation and action.
How to Use It
- Identify geographic hotspots: Pinpoint cities, regions, or states where engagement is highest. These areas represent opportunities for targeted advertising, influencer partnerships, or retail expansion. Double down on what's working.
- Optimize retail partnerships: Share geographic performance data with retail buyers to demonstrate demand in specific regions. If Target stores in Texas are driving significantly more scans than other states, that's leverage for securing better placement or expanded distribution in that region.
- Investigate underperforming areas: If you have distribution in regions showing low engagement, dig deeper. Is your packaging unclear? Are products poorly placed in stores? Is there a competitive disadvantage? Geographic insights help you diagnose problems and take corrective action.
- Plan regional campaigns: Use geographic concentrations to target local events, sponsorships, or partnerships. If Boulder, Colorado shows unusually high engagement, consider sponsoring local races, outdoor festivals, or retailer activations in that market.
Receipt Insights: Closing the Offline Attribution Gap
What It Shows
Receipt scanning data provides unprecedented visibility into three critical dimensions:
- Retailer performance: Number of receipts scanned by specific retailers
- Store-level performance: Geographic breakdown by state, region, or individual store locations
- SKU-level performance: Product-specific line items tracked through receipt validation
Each receipt scan connects back to an individual customer profile, creating a complete picture of who bought what, where, and when.
Why It Matters
Receipt insights deliver something consumer brands almost never get: true offline attribution. When customers scan receipts to validate rebate claims or product registrations, you're capturing structured data about their actual retail purchase behavior. This visibility is transformative for brands selling through wholesale channels, where point-of-sale data is typically delayed, aggregated, and disconnected from individual customers.
With receipt insights, you can finally answer questions like: Which specific Target stores are driving the most purchases? Which SKUs perform best at Walmart versus specialty retailers? Which customers are repeat buyers, and where are they shopping? This level of granularity enables sophisticated retail strategy, targeted marketing, and data-driven conversations with retail partners.
How to Use It
- Strengthen retailer partnerships with performance data: Share concrete proof-of-performance metrics with retail buyers. When you can walk into a meeting and say, "Your stores drove 38% of our verified purchases last quarter, with the Dallas location outperforming by 60%," you're having a very different conversation than competitors who can only talk about syndicated sell-through data.
- Optimize retail marketing ROI: Identify which retailer activations, promotions, or placements are actually driving conversions. If you're running promotions at both Kroger and Whole Foods, receipt data shows which investment is paying off. Reallocate budget accordingly.
- Enable personalized engagement at scale: Trigger marketing flows based on verified purchase behavior. Send follow-up emails with recipes to customers who bought specific products. Recommend complementary items based on SKUs purchased. Create VIP segments for repeat buyers at premium retailers.
- Guide geographic expansion decisions: Use store-level data to identify high-performing locations and regions. If certain stores or markets consistently overperform, work with retailers to replicate those conditions elsewhere or expand distribution in similar markets.
- Inform product development and merchandising: SKU-level insights reveal which products resonate most with retail buyers. If certain flavors, sizes, or product lines significantly outperform in receipt scans, prioritize those items in retail pitches and expansion discussions.
Conversion Funnel Insights: Uncovering Friction Points
What It Shows
A funnel-style visualization that breaks down customer progression through each stage:
- Scans/Clicks: Initial traffic to your experience
- Initiations: Users who begin the registration or rebate process
- Submissions: Completed form submissions
- Approvals: Validated rebate claims
- Payouts: Processed rebate payments
Why It Matters
Conversion funnel insights reveal exactly where customers drop off in your experience. If you have 1,000 scans but only 200 submissions, you're losing 80% of potential profiles somewhere in the flow. Understanding where and why customers abandon the process enables targeted optimization that dramatically improves conversion rates.
For rebate experiences specifically, tracking through approval and payout stages ensures you're monitoring program integrity and identifying potential fraud or operational issues.
How to Use It
- Diagnose friction points: If drop-off is highest between initiations and submissions, your form is too long or complex. Reduce required fields, simplify language, or improve mobile optimization. If drop-off happens between scans and initiations, your value proposition isn't clear enough—strengthen your messaging about what customers get in exchange for participating.
- Compare performance across variants: Run A/B tests with different form lengths, incentive levels, or design approaches. Use funnel data to identify which variant drives the highest completion rate, then scale the winner.
- Optimize for specific objectives: If your goal is maximizing profile capture, focus on improving the scans-to-submissions conversion. If you're running rebate programs and need to manage payout rates, monitor approval-to-payout ratios and investigate outliers.
- Identify operational issues: Unusual drop-off between approvals and payouts may indicate payment processing problems, fraud detection errors, or communication gaps. Use funnel insights as an early warning system for operational problems.
Top X by Y Data: Identifying What Drives Engagement and Revenue
What It Shows
Flexible segmentation that allows you to analyze performance across multiple dimensions, including:
- Experiences: Which campaigns or SKU-specific experiences perform best
- Geographic: Performance by country, state/region, or city
- Language: Engagement patterns across different languages
- Device, browser, and OS: Technical performance and user experience insights
- Metrics: Scans, registrations, website visits, revenue types, and rebate payouts
Data can be visualized as pie charts, bar graphs, or detailed tables depending on your analytical needs.
Why It Matters
This segmentation capability transforms raw data into actionable insights. Instead of just knowing you had 10,000 scans last month, you can see that 40% came from one experience, that mobile users on iOS convert 20% better than Android, and that Spanish-language experiences outperform English in specific markets. These granular insights enable surgical optimization and strategic resource allocation.
How to Use It
- Prioritize high-performing experiences: Identify which campaigns, products, or experience types are driving the most engagement and revenue. Double down on what works by expanding successful experiences to new products or markets.
- Optimize device-specific UX: If you notice that iOS users convert at significantly higher rates than Android users, investigate whether your experience renders poorly on Android browsers. Similarly, if desktop engagement is unusually low, your experience may not be optimized for larger screens.
- Localize content strategically: Compare engagement and revenue across languages and countries. If your Spanish-language experiences dramatically outperform English in regions with bilingual populations, prioritize Spanish-first design. If certain countries show high scans but low revenue, investigate whether pricing, shipping, or payment options are barriers.
- Inform retailer conversations: Show retail partners performance data for their specific markets. If Walmart drives 30% of your total scans but only represents 20% of your distribution, that's evidence to request expanded shelf space or promotional support.
- Identify underperforming segments: Use this data to diagnose problems. If a specific experience is underperforming despite high distribution, investigate whether the incentive is weak, the packaging callout is unclear, or the experience design has technical issues.
Turning Data Into Action: Building Your Analytics Practice
The analytics available through Brij represent an unprecedented opportunity for consumer brands to understand their customers, prove marketing ROI, and make data-driven decisions about product strategy, retail partnerships, and customer engagement. But access to data is only valuable if you use it strategically.
Here's how leading brands build analytics practices that drive meaningful business outcomes:
- Establish regular reporting cadence. Don't just check your dashboard when something goes wrong. Build weekly or monthly reporting rhythms where you review key metrics, identify trends, and adjust strategies based on what you're learning.
- Set benchmarks and goals. Track how your metrics improve over time. If your scan-to-registration conversion rate is 25% today, set a goal to reach 30% next quarter. Measure progress and hold yourself accountable.
- Connect analytics to revenue. Always tie your metrics back to business outcomes. Don't just report profiles collected—report total value captured. Don't just show scans—show how packaging improvements drove a 40% increase in customer acquisition.
- Share insights cross-functionally. Analytics aren't just for marketing teams. Sales teams can use receipt insights in retailer conversations. Product teams can use engagement data to inform development priorities. Finance teams need revenue metrics to forecast and plan.
- Test, learn, and iterate. Use your analytics to run experiments. What happens if you increase your rebate value? How does changing QR code placement impact scans? What message resonates best in your target demographic? Let data guide your optimization efforts.
The brands that win in omnichannel commerce aren't the ones with the most data—they're the ones that turn data into action. Brij gives you the visibility, intelligence, and insights to do exactly that.
Not on Brij yet, but want to unlock these insights? Click here to book a Brij demo with our team of expert omnichannel strategists and discover how your brand can drive measurable growth with Brij.